
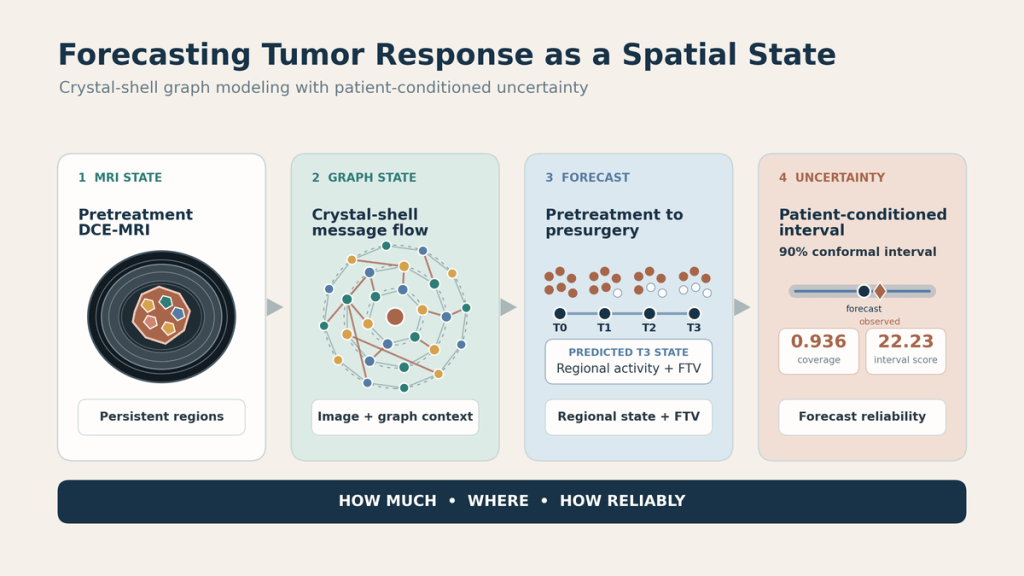
A presurgery tumor-volume estimate can be numerically close while hiding the spatial pattern that produced it. I designed this research around a stricter question: from one pretreatment dynamic contrast-enhanced breast MRI, could a model forecast how much enhancing tumor would remain, where it would remain, and how reliable the volume forecast was for that patient?
The result is a retrospective tumor-state forecasting study that combines image embeddings, an anatomy-aligned graph, and patient-conditioned conformal uncertainty. It is a research model, not a clinical decision system.
The research story in a minute
- My role: I defined the longitudinal graph state, crystal-shell relations, matched controls, linked regional and volume endpoints, and uncertainty-selection protocol.
- The hardest decision: A close tumor-volume estimate is not evidence that the regional pattern is correct. I tested scalar and spatial errors separately.
- Evidence: The manuscript reports retrospective held-out results for 202 ACRIN-6698 patients nested in the I-SPY2 trial family, with aggregate ablations and an interval-width tradeoff.
- Limit: This is not independent-trial or clinical validation. The secondary pCR classifier also uses observed early-treatment features.
Jump to: graph state and pipeline figure · regional ablation · uncertainty tradeoff · next tests and limitations.
The study at a glance
| Input | One pretreatment DCE-MRI examination |
| State | Registered tumor supervoxels with local image, enhancement, position, and volume features |
| Forecaster | Frozen ResNet-18 image embeddings with crystal-shell edge-gated message passing |
| Primary outputs | Presurgery regional tumor state and functional tumor volume (FTV) with a patient-specific 90% interval |
| Evaluation | 556 I-SPY2 patients for fitting and selection, then 202 held-out ACRIN-6698 patients for scoring |
ACRIN-6698 is nested within the I-SPY2 trial family. The evaluation therefore measures generalization across acquisitions and sites within that trial family, not validation on an independent trial.
Why forecast a graph state?
Most response models reduce the problem to one scalar or one classification decision. A scalar FTV can describe total enhancing burden, but it cannot show whether the model placed that burden in the correct tumor regions. A pCR probability can support a response classification, but it does not expose the regional state behind the prediction.
I represented the observed tumor as persistent supervoxel nodes whose identities were carried across imaging visits through registration. Each node contained local volume, position, enhancement measurements, and an embedding of the surrounding percent-enhancement and signal-enhancement-ratio patches. A frozen ResNet-18 produced those image embeddings.
The crystal-shell graph proposed connections within concentric tumor shells and across radial neighborhoods. Learned edge gates then controlled how strongly neighboring regions contributed to each update. Starting from pretreatment, the model rolled the graph state forward to presurgery. The predicted node geometry and activity produced a regional readout, while predicted node volume weighted by activity produced FTV.
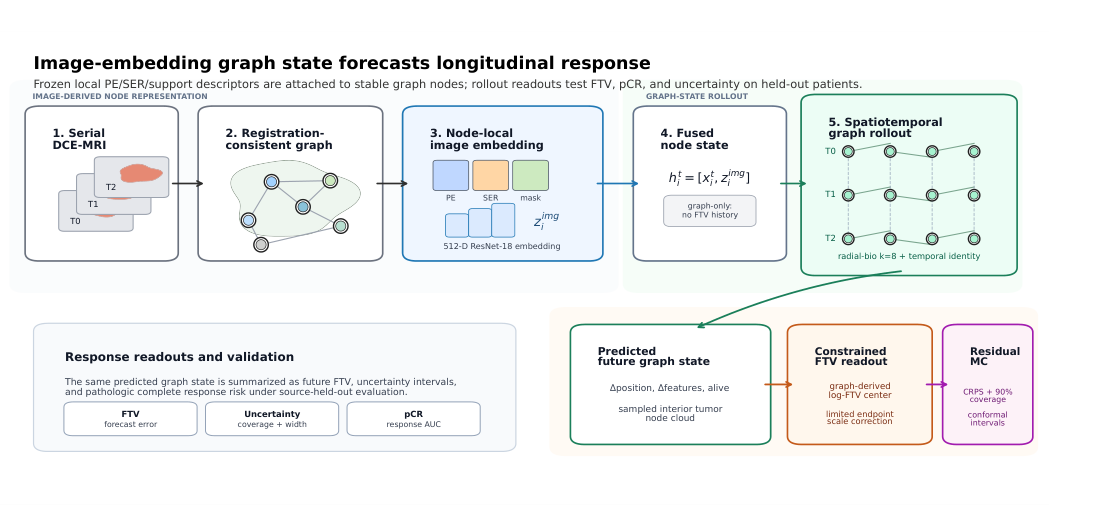
The frozen natural-image encoder was an experimental choice, not a claim that ImageNet pretraining is optimal for breast MRI. The important design decision was to test its contribution separately from graph communication.
Controlled comparisons explain what each component contributes
I compared three variants: a graph without image embeddings, an embedding model without neighborhood messages, and the complete image-embedding edge-gated graph. This ablation separated local image information from spatial communication.
| Research question | Held-out result | Interpretation |
|---|---|---|
| How much tumor remained? | 3.08 mL deterministic FTV MAE | The complete model recovered scalar enhancing burden at the reported error scale. |
| Where did it remain? | 3.40 mm mean Chamfer distance | The predicted and observed enhancing point clouds were compared spatially. |
| Did message passing help regional prediction? | Active-region count error fell from 14.13 to 2.24 | Image embeddings retained scalar accuracy, while graph communication carried much of the regional-activity signal. |
The no-message model retained a similar Monte Carlo FTV point-error scale, but its regional active-subregion count error increased sharply. Restoring crystal-shell message passing reduced that error 6.3-fold, from 14.13 to 2.24, at nearly unchanged scalar accuracy. The result supports a specific interpretation of the ablation: image content predicts much of how much, while spatial communication helps predict where. It does not prove that every graph edge is biologically causal.
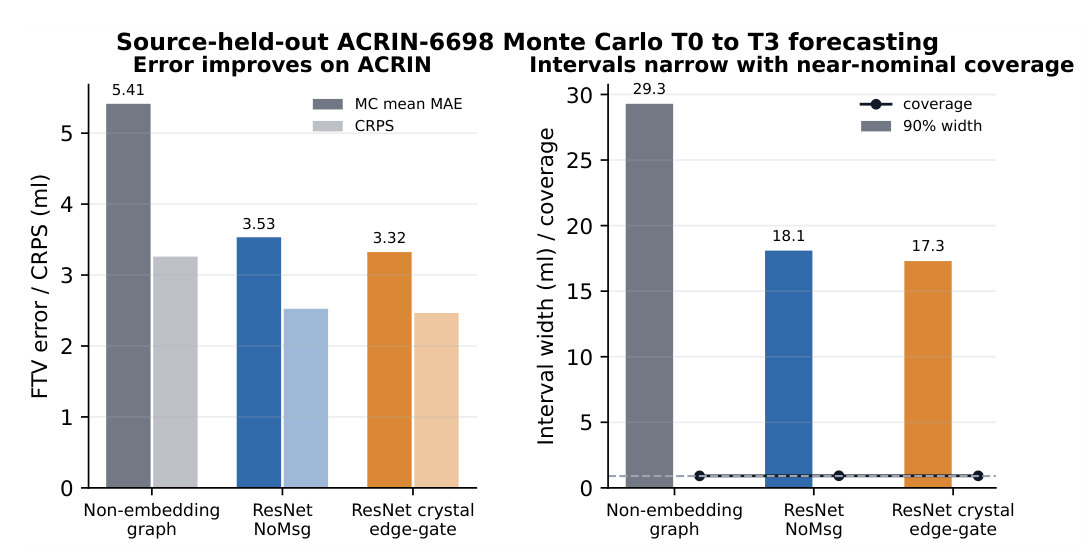
The 3.08 mL value is the deterministic FTV MAE. The figure above reports the separate Monte Carlo mean MAE, which was 3.32 mL for the full model.
Uncertainty must be selected without looking at the test cohort
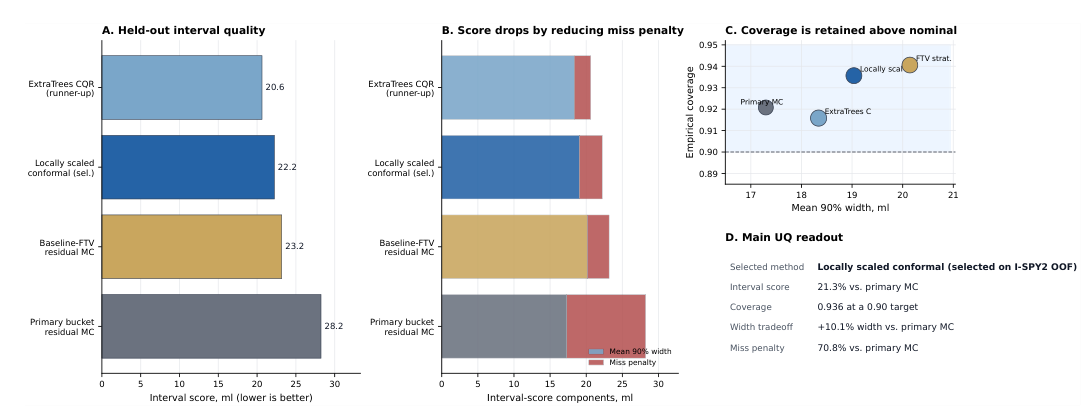
A prediction interval is useful only if its selection procedure is credible. The uncertainty pipeline first generated residual Monte Carlo FTV samples and conformal bounds. I then compared patient-conditioned recalibration methods using I-SPY2 out-of-fold interval scores under a coverage constraint. The selected locally scaled conformal method was frozen before ACRIN-6698 was scored.
On the held-out subset, the selected method changed the uncertainty readout as follows:
- The 90% interval score improved from 28.24 to 22.23.
- Coverage increased from 0.921 to 0.936.
- Mean interval width increased from 17.30 to 19.04 mL.
- The FTV point estimate did not change.
This was a useful tradeoff, not a free improvement. The interval score improved because outside-interval misses became less costly, while the average interval became wider. A different candidate achieved a lower score after ACRIN scoring, but it was not the training-selected method. Choosing it afterward would use knowledge of the held-out subset.
A secondary pCR analysis needs a precise boundary
The predicted graph state also supported a secondary pathologic complete response analysis. The selected feature stack reached a held-out AUC of 0.807, while a simpler clinical-plus-graph-temporal comparator reached 0.826. These classifiers included observed early-treatment and inter-regimen features. I therefore do not describe the pCR result as a prediction from pretreatment MRI alone.
The pCR analysis tests whether the graph representation carries response-related information. It does not show that the model chooses treatment, replaces clinical interpretation, or improves patient outcomes.
What I owned as a researcher and engineer
This project required more than fitting a model. The core work was defining an inspectable longitudinal state, preserving regional identity, constructing an anatomy-aligned graph relation, designing matched controls, connecting spatial and scalar endpoints, and separating uncertainty-method selection from held-out scoring. It also required tracing every public claim back to the exact evaluation protocol and keeping the research boundary explicit.
The difficult design choice was resisting a scalar-only success criterion. FTV error is easy to summarize, but it cannot establish whether the model forecast the correct regional response. The graph-state evaluation made that failure mode visible. The uncertainty evaluation added a second discipline: coverage, width, and miss penalty had to be considered together rather than compressed into one favorable number.
What I would test next
The strongest next step is evaluation on an independent breast MRI cohort. I would also test a domain-adapted image encoder, sensitivity to incomplete visits and upstream registration failures, and whether readers use the regional forecast and interval differently from an FTV point estimate alone. A matched comparison against dedicated pCR-first models would clarify the value of the secondary classifier.
Those steps matter because this study used a selected retrospective cohort with complete imaging and successful processing. No prospective deployment or patient benefit has been demonstrated.
The contribution is a modeling framework that keeps three outputs connected: regional response, scalar tumor burden, and calibrated reliability. That combination creates a more inspectable foundation for advanced modeling than a point prediction alone, while leaving the evidence boundary intact.
Read my PhD research overview · See my production AI engineering case study · Choose a résumé

